The goal of this profiling system is to give the front office a tool that can be used to gather a lot of valuable information about how well an athlete can produce power.
The graph below quickly allows us to quantifiably assess an athletes ability in 5 vital areas needed to produce power. The results of which are based on a composite score of different tests and assessments that fall under the umbrella of each category.
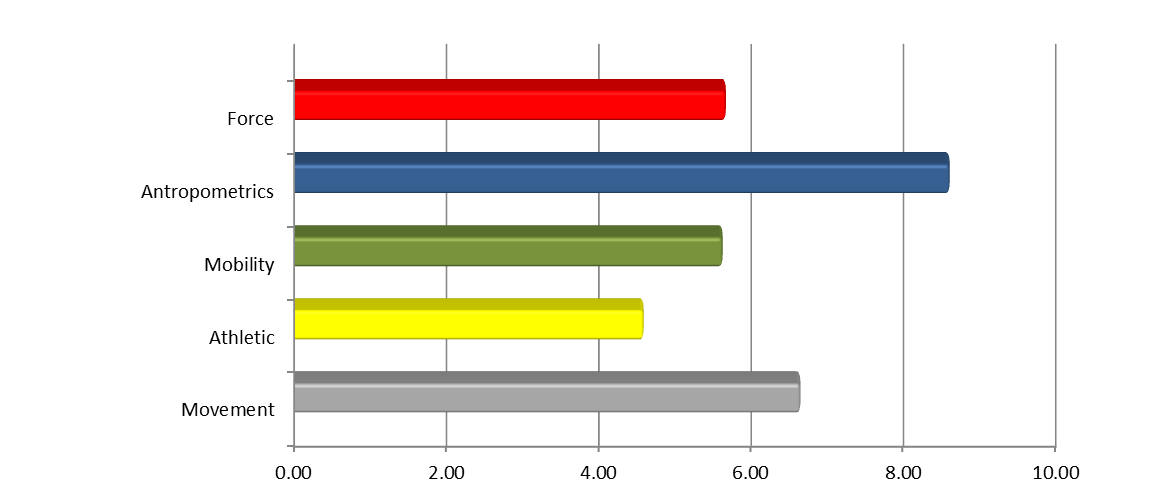
Here are some of the questions that are each category can help quickly answer:
- Force: how big is he? what can of mass does this athlete have to produce momentum towards home plate?
- Antropometrics: how tall and how long is this athlete? Do they have the limb length needed to produce the kind of speed needed to throw at an elite level?
- Mobility: how much range of motion does this athlete have? Do they enough mobility in vital areas (hips and shoulder) needed to give their limbs enough time to move far enough to produce velocity?
- Athletic: how fast can this athlete move? Are they explosive enough to produce a lot of force in a short amount of time?
- Movement: how well do they move? Does this athlete have a solid foundation to help reduce the likelihood of injury?
These 5 categories were selected based on the fact that they can be used to help determine how much power an athlete can produce by simply adapting the basic formula for power seen below.
 On the top half of the equation, we want to see how much Work (Force x Distance) an athlete can create which is why it’s beneficial to be a heavy with long limbs and lots of mobility. But to create power we have to take time into consideration because baseball is built around fast and explosive movements that require athleticism. The players that excel in this area due to their speed and athleticism can make up for the fact that doesn’t have the size, length and/or mobility to create lots of work on the top half of the equation.
This is how I have adapted this equation for baseball with these 5 vital categories:
Power = Force x (Antropometrics x Mobility)/Athletic
Using the composite scores we can come up with an overall power score for each athlete. Here is the score for the athlete in the graph seen above.
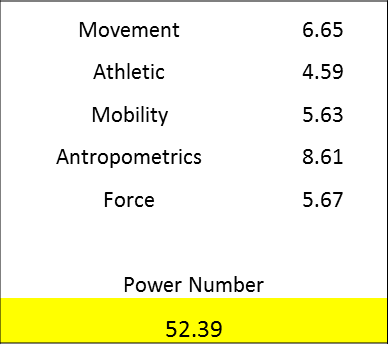
Power = 6.65 x (5.63 x 5.63) / 4.59*
*Note – The value for the athletic ability is altered to create the power number since it is better to have this number lower since its being used to divide the amount of work being created. This is done manually in that if an athlete scores a 9/10 they are given a score of 1 while the 4/10 athlete gets a 6.
Getting an overall score creates value but more importantly, it highlights areas of strength and weakness which can then be addressed.
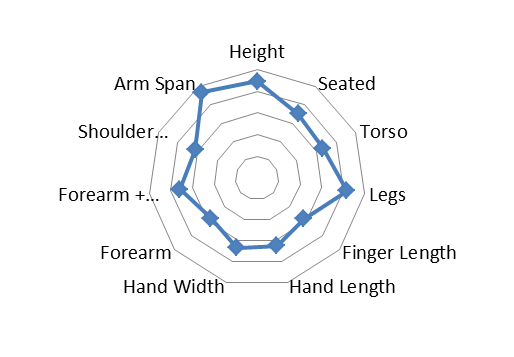
Each category has its own graph that can be used to gain an even deeper understanding about each payer and their unique sets of athletic attributes and physical capabilities with the radar graphs seen below which are used to create the composite scores seen above. This anthropometric radar graph let’s use see quickly not only how tall a player is but also how long certain segments of their bodies are compared to their peers.
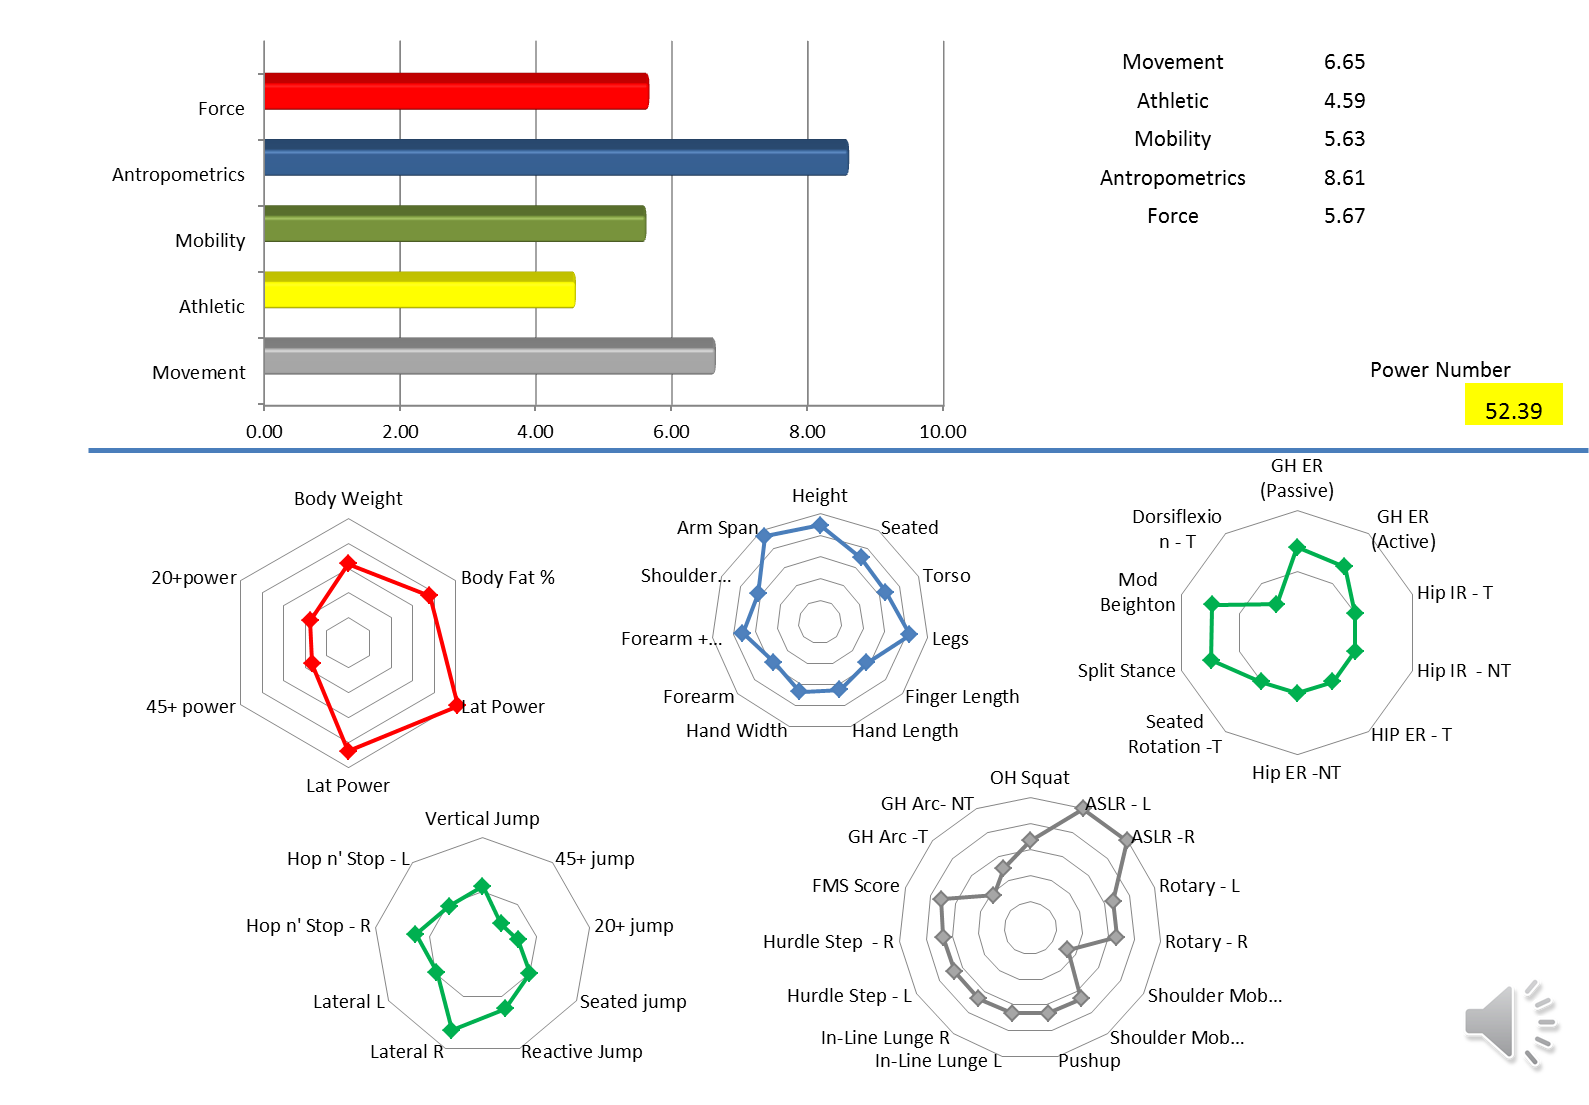
Here is what the one pager for each player would look like with all the information that we’ve covered today.

Discussion
No comments yet.